The English Learner (EL) program reporting requirements for North Dakota districts are recorded in the State Automated Reporting System (STARS). The reports required for EL programs include the MIS01 Fall Report, EL student enrollment records, and the MIS02 and MIS03 for EL staffing records. Below you will find most recent EL enrollment data. Guidance for the EL reporting in the STARS can be found under EL Guidance and Resources.
ND English Learner Students by Public School District
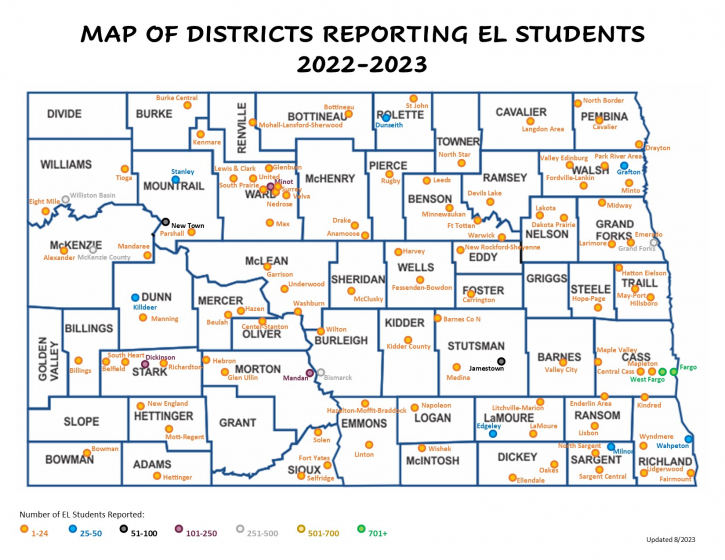
2022-2023 ND English Learner Students by Public School District
This color-coded map shows the number of English Learner students reported by North Dakota public school districts for the 2022-2023 school year. There is also a data table below that shows the same information in a more numeric format. Due to FERPA privacy regulations, districts reporting 1 to 24 English learner students do not show a specific number.
| Alexander | <25 | Anamoose | <25 | Barnes County North | <25 |
| Belfield | <25 | Beulah | <25 | Billings County | <25 |
| Bismarck | 441 | Bottineau | <25 | Bowman County | <25 |
| Burke Central | <25 | Carrington | <25 | Cavalier | <25 |
| Center-Stanton | <25 | Central Cass | <25 | Dakota Prairie | <25 |
| Devils Lake | <25 | Dickinson | 191 | Drake | <25 |
| Drayton | <25 | Dunseith | 35 | Edgeley | 31 |
| Eight Mile | <25 | Ellendale | <25 | Emerado | <25 |
| Enderlin Area | <25 | Fairmount | <25 | Fargo | 968 |
| Fessenden-Bowdon | <25 | Fordville-Lankin | <25 | Ft Totten | <25 |
| Ft Yates | <25 | Garrison | <25 | Glen Ullin | <25 |
| Glenburn | <25 | Grafton | 44 | Grand Forks | 269 |
| Harvey | <25 | Hatton Eielson | <25 | Hazelton-Moffit-Braddock | <25 |
| Hazen | <25 | Hebron | <25 | Hettinger | <25 |
| Hillsboro | <25 | Hope-Page | <25 | Jamestown | 83 |
| Kenmare | <25 | Kidder County | <25 | Killdeer | 26 |
| Kindred | <25 | Lakota | <25 | LaMoure | <25 |
| Langdon Area | <25 | Larimore | <25 | Leeds | <25 |
| Lewis & Clark | <25 | Lidgerwood | <25 | Linton | <25 |
| Lisbon | <25 | Litchville-Marion | <25 | Mandan | 151 |
| Mandaree | <25 | Manning | <25 | Maple Valley | <25 |
| Mapleton | <25 | Max | <25 | May-Port | <25 |
| McClusky | <25 | McKenzie County | 258 | Medina | <25 |
| Midway | <25 | Milnor | 28 | Minnewaukan | <25 |
| Minot | 135 | Minto | <25 | Mohall-Lansford-Sherwood | <25 |
| Mott-Regent | <25 | Napoleon | <25 | Nedrose | <25 |
| New England | <25 | New Rockford-Sheyenne | <25 | New Town | 72 |
| North Border | <25 | North Sargent | <25 | North Star | <25 |
| Oakes | <25 | Park River Area | <25 | Parshall | <25 |
| Richardton-Taylor | <25 | Rugby | <25 | Sargent Central | <25 |
| Selfridge | <25 | Solen | <25 | South Heart | <25 |
| South Prairie | <25 | St John | <25 | Stanley | 49 |
| Surrey | <25 | Tioga | <25 | Underwood | <25 |
| United | <25 | Valley City | <25 | Valley-Edinburg | <25 |
| Velva | <25 | Wahpeton | 33 | Warwick | <25 |
| Washburn | <25 | West Fargo | 1040 | Williston Basin | 454 |
| Wilton | <25 | Wishek | <25 | Wyndmere | <25 |
ND English Learner Home/Heritage Languages 2017-2022
ND English Learner Home/Heritage Languages 2017-2022
| School Year | 2016-17 | 2017-18 | 2018-19 | 2019-20 | 2020-21 | 2021-22 |
| Language | Count | % | Count | % | Count | % | Count | % | Count | % | Count | % |
|---|---|---|---|---|---|---|---|---|---|---|---|---|
| Spanish | 1101 | 31% | 1166 | 30% | 1480 | 33% | 1617 | 35% | 1553 | 36% | 1574 | 38% |
| Nepali | 426 | 12% | 482 | 12% | 480 | 11% | 446 | 10% | 402 | 9% | 329 | 8% |
| Somali | 516 | 14% | 562 | 14% | 520 | 12% | 436 | 9% | 381 | 9% | 330 | 8% |
| Arabic | 200 | 6% | 194 | 5% | 205 | 5% | 193 | 4% | 155 | 4% | 144 | 4% |
| Bosnian | 96 | 3% | 97 | 3% | 94 | 2% | 80 | 2% | 80 | 2% | 70 | 2% |
| Ojibwa | 63 | 2% | 50 | 1% | 45 | 1% | 61 | 1% | 51 | 1% | 41 | 1% |
| Dakota | 30 | 1% | 10 | 0% | 13 | 0% | 15 | 0% | 20 | 0% | 13 | 0% |
| *Indian | 32 | 1% | 19 | 0% | 19 | 0% | 14 | 0% | 17 | 0% | 19 | 0% |
| **Creoles | 200 | 6% | 229 | 6% | 313 | 7% | 336 | 7% | 318 | 7% | 313 | 8% |
| Swahili | 108 | 3% | 110 | 3% | 129 | 3% | 141 | 3% | 135 | 3% | 112 | 3% |
| Siouan | 29 | 1% | 24 | 1% | 30 | 1% | 29 | 1% | 34 | 1% | 32 | 1% |
| Chinese | 54 | 2% | 51 | 1% | 61 | 1% | 52 | 1% | 52 | 1% | 49 | 1% |
| French | 83 | 2% | 80 | 2% | 92 | 2% | 88 | 2% | 82 | 2% | 82 | 2% |
| Vietnamese | 50 | 1% | 60 | 2% | 80 | 2% | 85 | 2% | 70 | 2% | 74 | 2% |
| Tagalog | 44 | 1% | 62 | 2% | 85 | 2% | 91 | 2% | 73 | 2% | 67 | 2% |
| Other | 571 | 16% | 689 | 18% | 848 | 19% | 939 | 20% | 873 | 20% | 866 | 21% |
| Total | 3603 | 3885 | 4496 | 4624 | 4296 | 4115 |
Percentages are rounded to the nearest whole percent.
*Indian = North American Indian - Other
**Creoles = Creoles/Pidgin - English-Based
ND English Learner Enrollment by District 2017-2022
ND English Learner Enrollment by District 2017-2022
Due to FERPA privacy regulations, districts reporting 1 to 24 English learner students do not show a specific number.
| 2016-17 | 2017-18 | 2018-19 | 2019-20 | 2020-21 | 2021-22 |
| District | Count | % | Count | % | Count | % | Count | % | Count | % | Count | % |
|---|---|---|---|---|---|---|---|---|---|---|---|---|
| Fargo | 933 | 26% | 969 | 25% | 1022 | 23% | 1001 | 23% | 927 | 20% | 818 | 20% |
| Bismarck | 246 | 7% | 277 | 7% | 346 | 8% | 375 | 8% | 411 | 9% | 388 | 9% |
| Dickinson | 113 | 3% | 127 | 3% | 182 | 4% | 192 | 4% | 187 | 4% | 172 | 4% |
| Dunseith | 58 | 2% | 47 | 1% | 40 | 1% | 54 | 1% | 45 | 1% | 36 | 1% |
| Grafton | 48 | 1% | 49 | 1% | 41 | 1% | 37 | 1% | 39 | 1% | 41 | 1% |
| Grand Forks | 360 | 10% | 396 | 10% | 341 | 8% | 326 | 7% | 301 | 7% | 260 | 6% |
| Mandan | 85 | 2% | 112 | 3% | 137 | 3% | 128 | 3% | 139 | 3% | 140 | 3% |
| McKenzie Co | 70 | 2% | 98 | 3% | 217 | 5% | 251 | 5% | 239 | 5% | 228 | 6% |
| Minot | 178 | 5% | 163 | 4% | 213 | 5% | 184 | 4% | 162 | 4% | 133 | 3% |
| New Town | 28 | 1% | 51 | 1% | 61 | 1% | 69 | 1% | 58 | 1% | 60 | 1% |
| West Fargo | 752 | 21% | 875 | 23% | 1002 | 22% | 1076 | 23% | 1054 | 23% | 893 | 22% |
| Williston | 182 | 5% | 240 | 6% | 316 | 7% | 338 | 7% | 322 | 7% | 365 | 9% |
| Others | 551 | 15% | 481 | 12% | 580 | 13% | 671 | 14% | 682 | 15% | 615 | 15% |
| Total | 3603 | 3885 | 4498 | 4702 | 4566 | 4149 |
Percentages are rounded to the nearest whole percent.
ND English Learner Demographics 2012-2022
ND English Learner Demographics 2012-2022
| Year | # ELs | # Immigrant | % Immigrant | # Refugee | % Refugee | # Migrant | % Migrant |
|---|---|---|---|---|---|---|---|
| 2011-12 | 4360 | 730 | 17% | 1157 | 27% | 265 | 6% |
| 2012-13 | 3871 | 761 | 20% | 1111 | 29% | 211 | 6% |
| 2013-14 | 3823 | 182 | 5% | 1 | 4% | 21 | 1% |
| 2014-15 | 3996 | 1500 | 38% | 1107 | 28% | 173 | 5% |
| 2015-16 | 3263 | 1329 | 41% | 1061 | 33% | 191 | 6% |
| 2016-17 | 3443 | 1603 | 47% | 1034 | 30% | 121 | 4% |
| 2017-18 | 3885 | 1765 | 46% | 1054 | 27% | 101 | 3% |
| 2018-19 | 4498 | 1980 | 44% | 944 | 20% | 136 | 3% |
| 2019-20 | 4624 | 1741 | 38% | 778 | 17% | 153 | 3% |
| 2020-21 | 4470 | 1500 | 34% | 605 | 14% | 122 | 3% |
| 2021-22 | 4115 | 1134 | 28% | 362 | 9% | 134 | 3% |
Percentages are rounded to the nearest whole percent.
ND English Learner Ethnicity 2012-2022
ND English Learner Ethnicity 2012-2022
| Total | Native Am. | Asian | Black | Hispanic | P. Islander | White |
| Count | Count | % | Count | % | Count | % | Count | % | Count | % | Count | % | |
|---|---|---|---|---|---|---|---|---|---|---|---|---|---|
| 2011-12 | 3634 | 1116 | 31% | 464 | 13% | 751 | 21% | 800 | 22% | 22 | 1% | 481 | 13% |
| 2012-13 | 3239 | 595 | 18% | 573 | 18% | 815 | 25% | 780 | 24% | 25 | 1% | 451 | 14% |
| 2013-14 | 3264 | 422 | 13% | 624 | 19% | 866 | 27% | 877 | 27% | 22 | 1% | 453 | 14% |
| 2014-15 | 3561 | 318 | 9% | 666 | 19% | 1059 | 30% | 1042 | 29% | 24 | 1% | 452 | 13% |
| 2015-16 | 3617 | 210 | 6% | 715 | 20% | 1138 | 32% | 1079 | 30% | 19 | 1% | 456 | 13% |
| 2016-17 | 3603 | 175 | 5% | 698 | 19% | 1186 | 33% | 1046 | 29% | 17 | 1% | 481 | 13% |
| 2017-18 | 3885 | 123 | 3% | 792 | 20% | 1329 | 34% | 1110 | 29% | 17 | 0% | 514 | 13% |
| 2018-19 | 4498 | 129 | 3% | 876 | 20% | 1490 | 33% | 1427 | 32% | 45 | 1% | 1031 | 23% |
| 2019-20 | 4624 | 158 | 3% | 876 | 19% | 1467 | 32% | 1569 | 34% | 69 | 2% | 485 | 11% |
| 2020-21 | 4470 | 160 | 4% | 800 | 18% | 1397 | 31% | 1568 | 35% | 91 | 2% | 454 | 10% |
| 2021-22 | 4115 | 140 | 3% | 686 | 17% | 1230 | 30% | 1537 | 37% | 108 | 3% | 414 | 10% |
Percentages are rounded to the nearest whole percent.